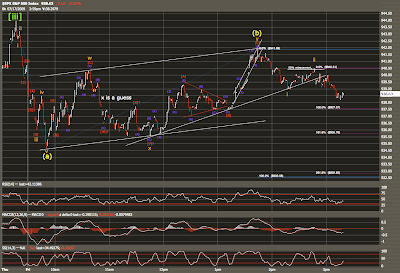
The market is correcting today as expected but the market remains strong. This correction should be wave [iv] which still has not reached the (iv) of [iii] territory. In fact wave [iii] has hardly been retraced and is still not even close to being 23.6% of [iii]. So expect the correction to continue into Monday unless the market really drops off and form 5 waves from (b).
The decline yesterday afternoon into this morning looks like a clear 5-wave (a) wave. So (c) should also be five waves completing a wave [iv] zigzag.
The extension of wave i is shown in purple, targets for (c) are shown in blue (the extension of (c)). 926.83 (not shown) is 161.8% of (c). (a) may also end up being 78.6% of (c), that is another target around 930. Also 927.5 was the lowest point the (iv) of [iii] triangle.
Problems:
[ii] was a zigzag pattern.
x is not clear. It does look non-impulsive so it's not really a problem.
Alternatives:
A triangle is forming where (a) is really three waves.
The zigzag is the first wave of a double zigzag.
This is the correction of a different impulse.
i and ii of (c) are really [1] and [2] of (c), respectively.
blog comments powered by Disqus