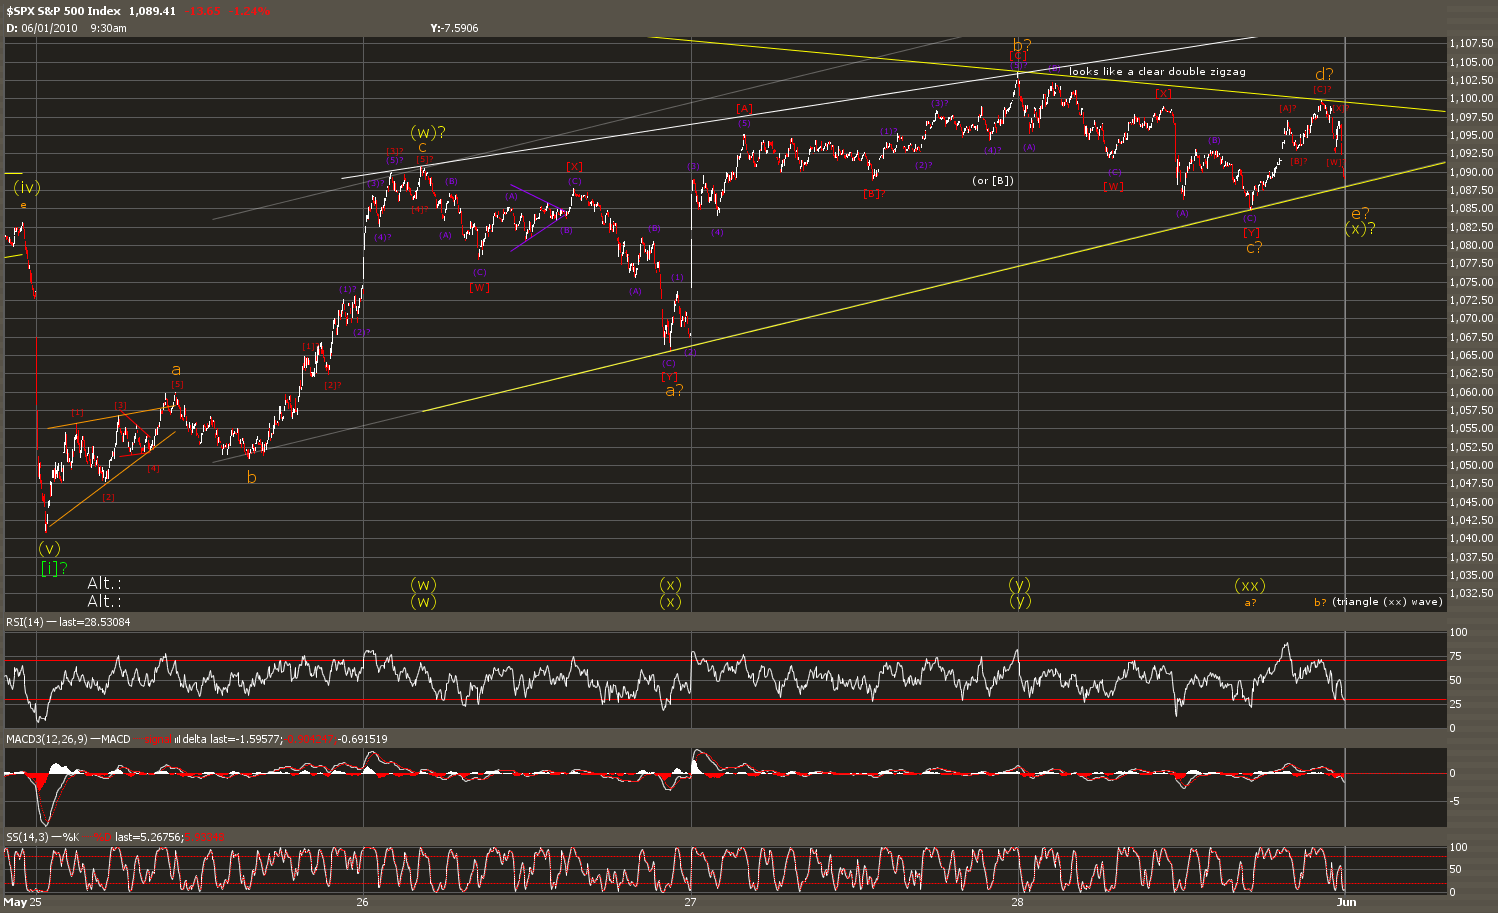
In the short term, the count has changed somewhat since Thursday's update. A triangle wave (x) of [ii] is suggested in the 1 minute chart above.

There appears to have been a double zigzag lower off Thursday's highs that was followed by a single zigzag higher. This single zigzag did not make a new high. Another wave lower began about 30 minutes before the close, but so far this is also a corrective looking wave. The generally corrective looking waves that fit within the contracting lines above work well as the legs of a triangle. Note that there is an alternative triangle count in the first chart.

A few targets have been introduced above. The apex of (x) may of course be useful (for reasons of resistance and of time), but take note of the green line. Near 2:00pm on 6/1/10 (Tuesday, the next trading day), wave [ii] will be 38.2% in time of the total time to complete waves [i] and [ii]. Time targets become more meaningful towards the end of an impulse when there are more sub-waves to analyze, however of this degree there is only one impulse wave to work with.

The larger view has not changed.
blog comments powered by Disqus