Friday, May 24, 2013
Friday 5/24/13 Market Update
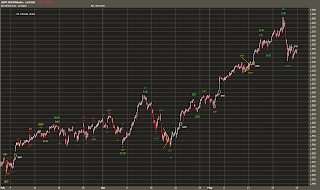
There is no change to the wave count since the last update. In the short term, it appears that wave [b] or [x] of A of (4) is underway. The waves following the last all-time high do not look particularly clear, but considering all the options, the short term wave structure still suggests lower prices in the days ahead.
The action down following the all-time high is now large enough for the April to May rally to certainly look like a complete wave.
If the alternate count is correct, there will be downside limited to a level just under Wednesday's low (within probably a sideways correction underway) before another run to all-time highs begins. The best option however is still wave (4) underway in probably a sideways fashion. If this is correct, the best projection is a continued wave A sell-off that will complete in the 1595-1600 support area to reach the low, or at least a significant low, within (4). In the short term wave [b] or [x] can surpass the Thursday high by a bit, but price should not remain above it for an extended period of time.
Note:
I am taking the week off so the next update will not be until the weekend.


blog comments powered by Disqus