Sunday, November 3, 2013
Friday 11/1/13 Market Update
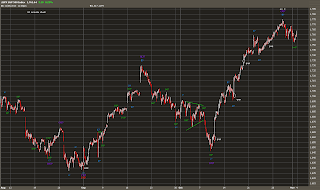
There is little change to the message since the last update. The size of the correction since the last recovery high is large enough to make the rally wave that began in October look complete. The probabilities of the alternate and alternate 2 wave counts will likely become the best options if there is wave crossing in the 1730 area. Regardless of which wave count is playing out, the short term looks bearish with a test of 1740 expected. If there is a rally within the next couple of days to a new all-time high or even above Thursday's high, the ending diagonal alternate wave count will likely become the best option with a sideways B of (5) of ending diagonal [C] of y underway (find the small change to this wave count in the daily chart below).
A complete zigzag wave higher is still possible, but an impulse seems like a much more natural labeling. A zigzag wave still developing, perhaps alternate (5) of ending diagonal [C] of y, is a better option The corrective wave since the last all-time high still seems small in relation to the other 'b' waves within ending diagonal [C], so more correction is also expected in this wave count. But keep in mind that the problem with the alternate wave count is the size of (5) given that it is already above the upper (1)(3) line with more development expected.
The very long-term view posted several years ago here is still valid. The rally since 2009 still works best as part of a 'b' or 'x' wave within sideways action beginning at the 1999/2000 high.


blog comments powered by Disqus