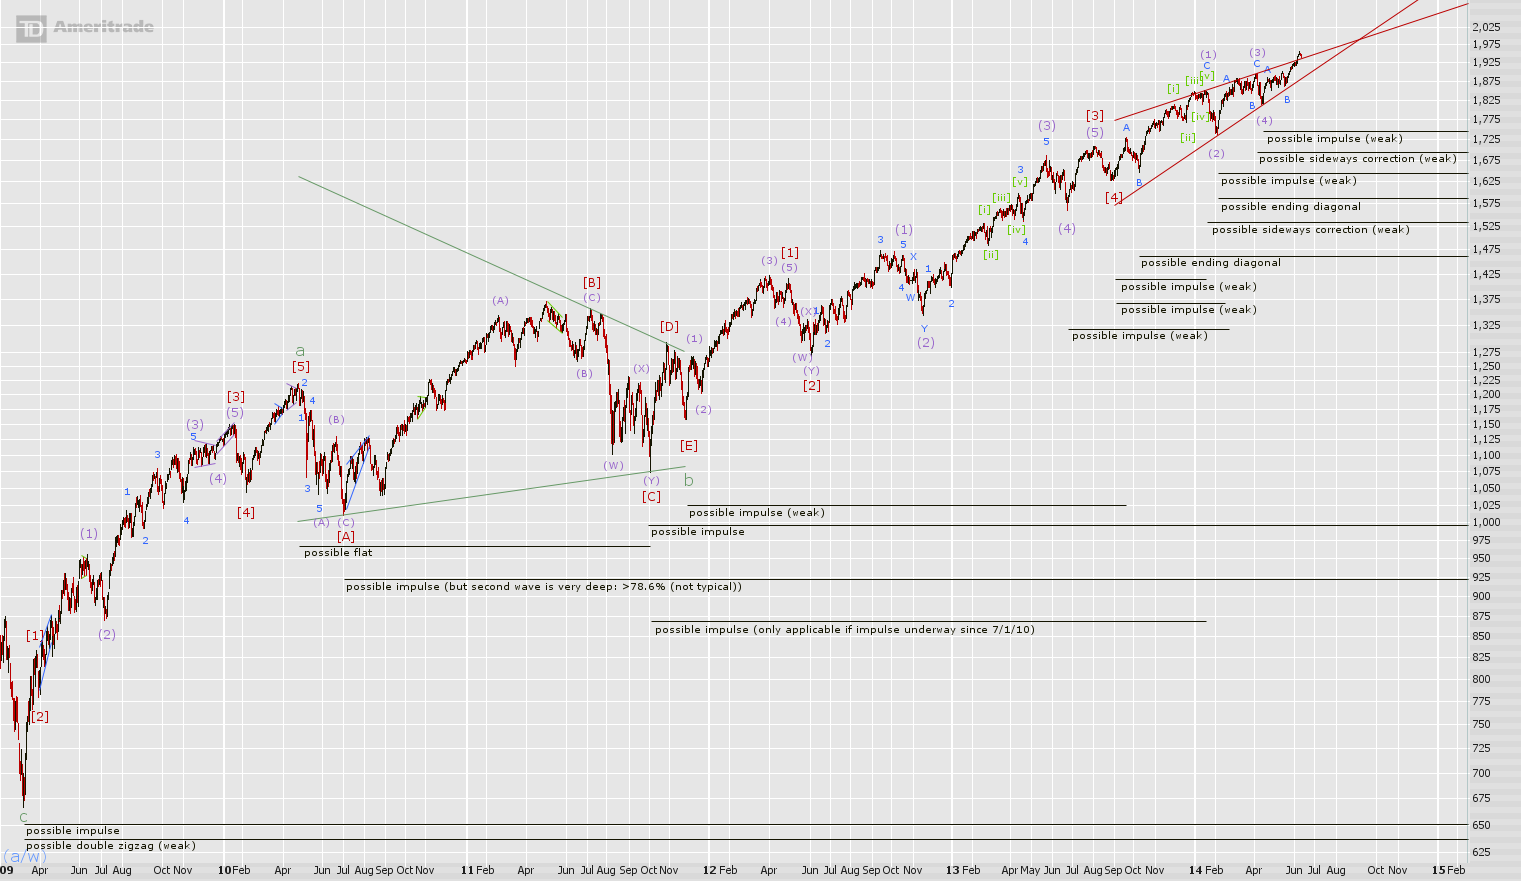
Last time the long-term options were discussed in great detail. Because nothing this week has caused a change to these possibilities, please refer to the last post for a full explanation of the long-term situation. To summarize, an impulse higher unfolding since the wave (4) low is a weak option at best due to the structure required before (4). A sideways pattern since wave (1) is not a poor option and is growing in probability. If correct, it is most likely a 4th wave where [C] in 2011 is a 2nd wave. A sideways structure underway since (3) is unlikely. Finally an ending diagonal higher since the [4], B, or (2) lows remain the best possibilities but the one beginning at the wave (2) low is the weakest choice among these.

1975.65 is an important level and is near current action. If it is taken out, wave (3) is then shorter than the wave higher from (4) which invalidates the only non-weak possibilities that currently exist, namely the ending diagonal possibilities as marked here. The wave count possibilities since (4) and later seem to confirm that this level will not be reached for some time.
Two double zigzag possibilities remain; zigzag 'w' to ii of (a) of [w] or zigzag 'w' to (b) of [y]. Both suggest another zigzag is underway or complete that began at the wave B low. If 'w' to (b) of [y] is accurate, the market is weeks away from completing 'y' because 'b' should be proportional to 'b' of 'w'. If there is a zigzag 'w' to ii of (a) of [w], the wave higher since B can be complete or nearly complete. This is a better option because proportionality between 'w' and 'y' is better and a single zigzag down from ii to [w] works well with the small sub-waves. It comes at the cost of greater complexity like all double zigzags vs single zigzags however and there is then a very small 'c' of 'w' wave that is truncated, an unusual development.
Because of the problems with these double zigzag options, they are labelled "weak". A single zigzag from (4) counts far more naturally and is simple.
Notice also the impulsive possibilities beginning at the wave B low. The sell-off from the C high is only well-proportioned to the wave [ii] and wave [iv] corrections. If there is an impulse higher from [ii], [iii] is the 1st wave and [v] is the 3rd wave. The 3rd wave is much shorter than the 1st and the core of the 3rd is nearly totally retraced. These are unusual qualities. The core of [v] can be moved lower, but there are then proportionality problems with the corrective waves nearest the end of the move.
[ii] to [v] can be an impulse wave where its 3rd wave terminated at the high just after [iii] and its 4th wave terminated at the low just before [iv] which brings moderate proportionality relative to the 2nd wave ((ii) of [iii]). But there is again the same structural problem as mentioned above when moving the core of [v] lower.

It is more visible above what the problem is when trying to label an impulse higher from b of (x). Within it, an impulse higher from (ii) seems to be the best attempt in doing so but the size of its corrections are distant from one another.
There is a choppy set of waves down following the all-time high. If this is happening following a significant bottom at [iv], the pattern would be more bullish. Given what we know about the action higher following B, an impulsive structure down is workable here. Structurally it labels as well as a double zigzag although the sideways upward 2nd wave corrections it uses are unusual. Sharp 2nd waves are more typical in impulse waves.
Read more at http://ewaveanalytics.com.
blog comments powered by Disqus