For more than 4 years on every Wednesday and Saturday (sometimes earlier on Friday), Vic and I publish our analysis and a consensus viewpoint at http://ewaveanalytics.com. A sample of my Elliott wave analysis is below. This is the same content I published today.

The S&P 500 posted losses every day this week, but the movement down from the all-time high has been overlapping and gradual. This is a more corrective than impulsive attribute and it works well with the analysis of the larger scales.
An impulse beginning in 2009 is likely nearly complete as wave (I). Its 5th wave should begin at IV where option should be following the colored labellings drawn in the chart above. (2) of [3] to [3] can be an impulse, but this adds complexity and will make V even larger than I. V is currently only slightly larger than I.
A triangle from [3] of V to (2) remains a very weak possibility due to poor symmetry but does allow for a complete impulse beginning at both (2) and IV.
A double zigzag can begin at [4] and be complete at the last all-time high, but its 'w' wave is clearly smaller than its 'y' wave. But if correct, a flat should be developing from [3]. This or any other sideways correction is clearly larger than any possible corrective pattern since IV, but a 3rd wave impulse can be in the II to [3] of V position. But this impulse has a large 5th wave. The impulse containing it also has a symmetry problem not to mention that it is more complex than (I).
In addition, an impulse from II to [3] of III is not a high probability. A correction from [3] of III to IV also has structural problems when identified as a wave.
A linear scale increases the size of action at recent highs so V is much larger than I. Perhaps a 3rd wave begins at IV, but action beginning in 2009 is then complex while it implies upside for 5+ more years before a larger pullback than has been seen since 2009 develops which is doubtful.
A linear scale resolves the size difference between [2] and [4] of III, but then II and IV are no longer about the same size.

If a double zigzag begins at [4], then 'x' is almost certainly in the 2 position. an impulse beginning at [a] of 2 suffers a deep ensuing retracement which is not typical of a 2nd wave while 'b' of 'w', wave (2), is then much larger than 'b' of 'y', wave [c] of 4. Of course [a] of 2 to (3) can be an impulse wave 'a', but action since 2 is already large relative to 'w'.
If complete, a double zigzag has a large wave 'b' of 'w' relative to 'b' of 'y', but this same problem exists in the the best impulse option beginning at [4]. An impulse underway from 2 avoids 4 being larger than 4 within impulse (3), but action since [4] grows in complexity while it is more likely that [5] be about the same size as [1] than not. 5 is smaller than 3 so if an impulse is developing from 2, 5 is probably a 1st wave.
An impulse from [a] of 2 to (3) has the same problems as wave 'a' in the same position, but if correct, it suggests that an impulse beginning at 1 is still underway where its 4th wave begins at the all-time high.
A correction underway from 3 is very unlikely. 2 has a high 'b' wave, but a 'b' or 'x' wave terminating at (3) is even worse. In other words, the size difference between [ii] and [iv] of 5 is very likely unavoidable.
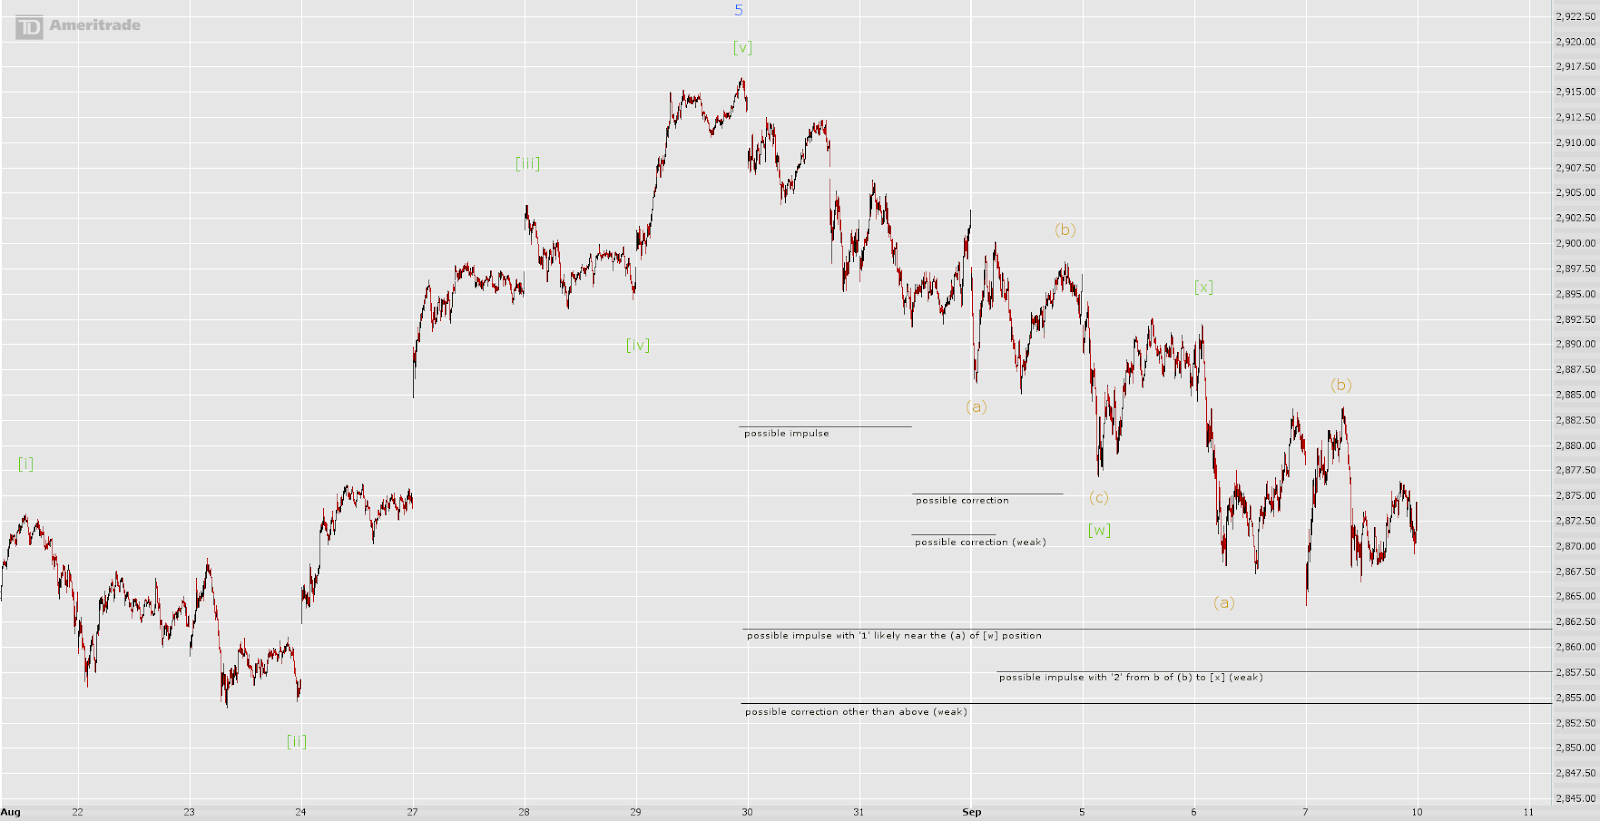
Action developing from (3) is shows overlap at many points. (a) of [w] is a reasonable impulse that simplifies the picture a bit. Trying to work in overlap after (a) in the same fashion results in much less success. If an impulse is developing from (3), then it is made complex by what appears to be a windup formed by a long string '1'-'2' waves, even if (a) is a 1st wave. Impulsive action like this is not common.
A better option is a zigzag-family wave developing from (3) where the overlap works much more naturally. Because there is so much overlap, a double zigzag as drawn above makes the most sense. [w] is reasonably symmetrical while allowing additional action lower to develop.
[y] can be complete at the midday low on the 7th. It would not be very uncommon for this to be the case. [y] is a bit smaller than [w] however, so (c) may also still be underway. This happens to make sense given that ~2850 happens to be a significant support area and the market may be seeking a retest.
In any case, (4) can be developing as a sharp or sideways pattern. A sideways pattern makes the most sense given that (4) is so far much smaller than both (2) and 2 of (3) while corrective action beginning at (3) is more likely complete or close to complete than not.
Final Analysis:
Action from the all-time high is most likely a complete or developing correction. Structure and well-defined support suggests that prices are not expected to drop under the upper 2840s before the all-time high is retested.
A sideways correction is probably underway from (3) of [5] of V. This is so (4) can seek a size like (2) or 2 of (3) while the short-term structure still makes sense. Weaker impulse options beginning at [4] allowing for more bullish upward action can also be developing.
A sideways correction underway from [3] of V remains possible. This implies that a 3rd wave is in the II to [3] of V position. A 3rd wave like this or one still incomplete that also begins at II continues to be an unlikely option. Impulse (I) developing from 2009 continues to be the best choice and by not a narrow margin.
S&P 3000 remains possible where V of (I) may or may not complete this year. When (I) does complete, a retest of the low of IV or the 2000 and 2007 highs is expected. But remember that a multi-decade uptrend is probably underway from the 2009 lows where (I) is just a 1st wave.
short-term (days-weeks): neutral
medium term (weeks-months): bullish
long-term (years): bearish
very long-term (decades): bullish
blog comments powered by Disqus