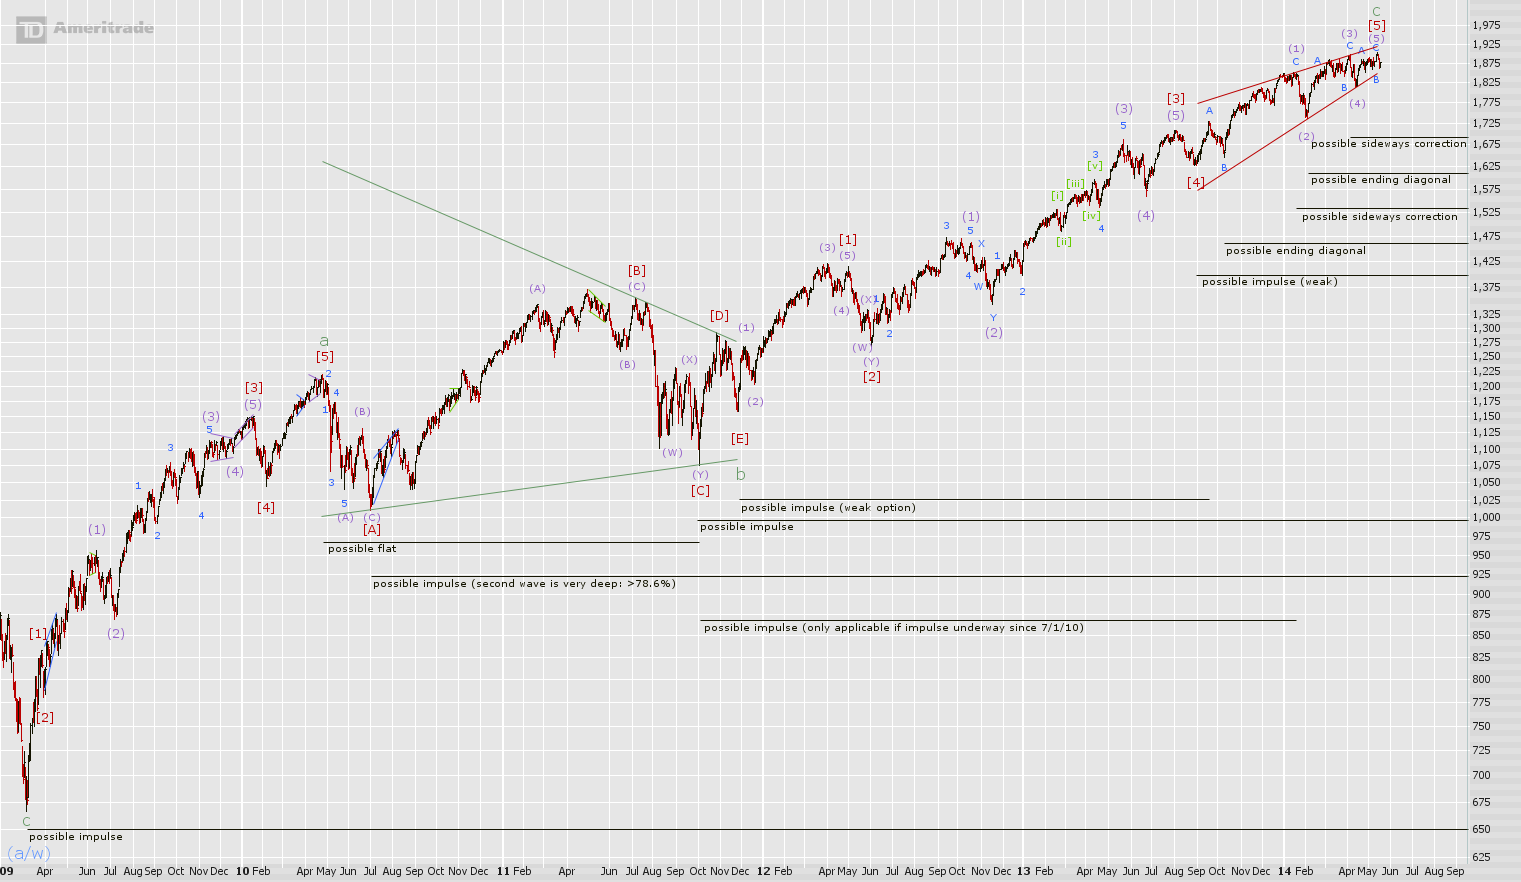
Last time the long-term options were discussed thoroughly and on this front, the view remains the same. Over the last two years, an impulse higher developing since [4], (2), or (4) is a weak option. A sideways correction beginning at (1) or an ending diagonal higher since (4), B, or (2) are far better options.
The waves since 2009 can be impulsive or corrective. It will take additional action in the next months to years to better determine which scenario is correct. This very long-term scale is certainly not relevant to the suggestions we post in the member's area.
A sideways correction beginning at (3) is possible, but is not that likely given the longer-term picture. A sideways correction since (1) would allow this sideways option, but it adds an additional degree of complexity and reduces the proportionality of waves within the pattern. It also makes the pattern less proportional to its 2nd wave counterpart in late 2011 so it is not that desirable.
A double zigzag higher developing from the (4) low would also complicate the situation, but this move could fit into the sideways option since (1) or the ending diagonal possibilities (the ending diagonal possibilities stay valid as long as price since (4) travels less than the price distance of (3)).
A sideways pattern since A is also a possibility, but a weak one. A complete flat from A to 1 seems reasonable at first, but is not even suggested above because it is essentially impossible impossible to work into the [a] to C action into any kind of zigzag-family wave. [b] to [e] also cannot be viewed as a flat when trying to force the matter.
An incomplete sideways correction since A is a better option, but a complete flat lower since [b], the most simple way to work in the waves, is a problem due to the fine structure of [d]; it looks like a double zigzag and if this is true, there can be no zigzag-family wave higher from [c] to C. If there is no complete flat in this position, things get complicated in a hurry. Maybe there is a double zigzag higher since [a], but [b] it hard to work in as a single zigzag. This would also make the double zigzag since [a] very large in relation to [a] which is not that common.
There is probably a complete single zigzag higher since the (4) low because it has no problems intrinsically, is simple, and works well with the good longer-term options. Especially after the breakdown this week, this possibility is clearly the most natural way of counting the structure.
Last time, it was stated, "[Thursday] prices should continue to sell-off. There can be a gap lower and if there is, this will probably prove the be the core of an impulse wave down beginning at C." The gap did not form all of the core, but prices did continue to sell-off in an impulsive fashion exactly as expected. There is now very likely a complete impulse wave down to 1.
It is not exactly clear what is forming since 1, but this so far has a corrective look to it.
Continue reading my commentary, the work of two other analysts, and the consensus opinion at http://ewaveanalytics.com.


blog comments powered by Disqus