This weekend I am providing one of my full updates from Elliott Wave Analytics for free. We post every Wednesday and Saturday. Find much more at http://ewaveanalytics.com including technical and trend analysis as well as our consensus opinion.

The prospect for an impulse complete or underway since (A) that contains the entire rally from that point is weaker than last time due to the developments today. If an impulse completed a major top, it must have done so at [b] of B. An impulse wave down likely did unfold in the [c] of B position, but the major retracement that ensued makes it doubtful that the bounce today is a 2nd wave or even 'b' wave.
If the rally that began at today's low is the 5th wave of an impulse which began at (A), then the proportionality of the 4th wave from [iii] to B and 2nd wave [ii] is poor. Due to this and the major retracement today, it is likely that the rally higher since (A) is incomplete where an impulse wave higher completed at A or [b] of B, or a zigzag completed at [iii].
Perhaps a 3rd wave is underway since B or a 2nd wave is completing since at A or [b] of B. The problem with these possibilities is the shallowness of the 2nd wave and major size of the 1st wave. 3rd waves are usually the most powerful and largest waves and this is then difficult to obtain. Also if an impulse from (A) is a 5th wave which the good, relevant longer-term options suggest, a stretching at the end of an impulse wave would be more typical whereas here the opposite seems to be true here.
An ending diagonal underway since (A) would be a rare pattern and has the problem that if its 1st wave is complete, a sideways wave is likely underway or complete following any zigzag-family pattern higher (ending diagonals are 3-3-3-3-3 patterns). Even if [b] of B is the top of a zigzag, for an ending diagonal with its 1st wave complete, again there is the problem with the large retracement today and small size of Thursday-today's decline relative to the rest of the rally. An ending diagonal with 1st wave still underway as a single or double zigzag is more likely, but then the size it commands arguably makes the pattern a weak option. Regardless, the possibility of this pattern will be important in the future as it might be the only way of keeping the relatively strong option for a 5-wave move higher since (A) alive.
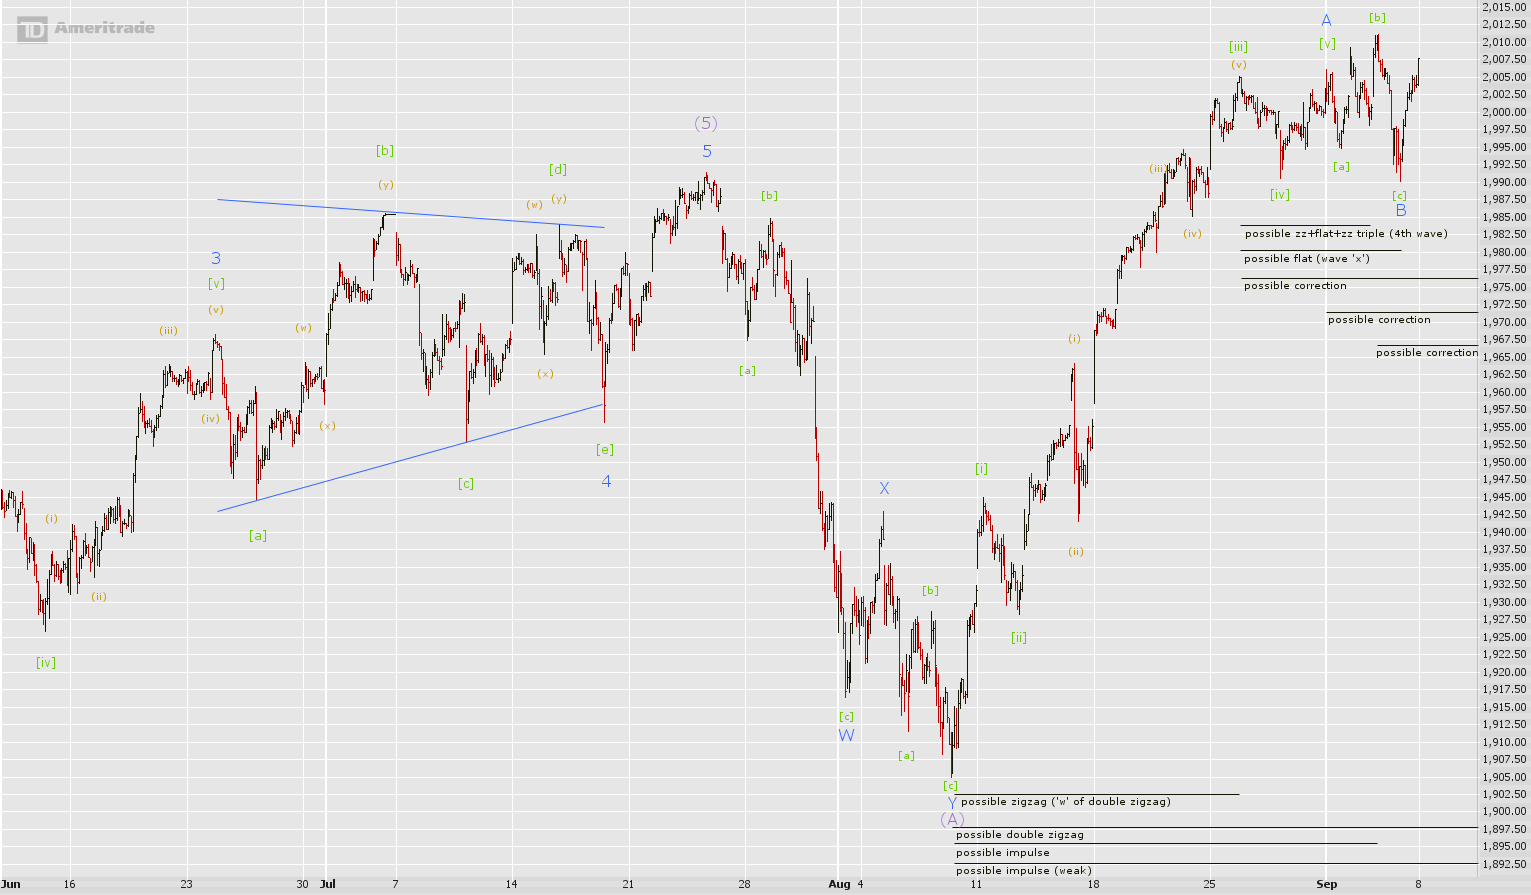
It should be noted that the structure of (A) to [iii] is fairly set in stone; [i] and [ii] are obviously 1st and 2nd waves, respectively. After this is a rally that has a large correction in the (ii) position that needs balance with a 4th wave above. Nothing is close to this size until the (iii) to (iv) region is reached. Going above this to [iii] for the pairing is possible, but then the presence of only small corrections from (ii) to (iii) or just under are left with no proper pairings. In other words an impulse from (ii) to [iii] or higher does not look good.
What happens after [iii] is not so clear; an impulse from (A) can be complete at [v], (w) of [b] of B, or [b]. Or there can just be a zigzag to [iii].

The move down from [b] to B looks most like a 5-wave impulse. If the wave is an impulse, there can be a flat lower from (w) of [b], A, or [iii], each of which can be part of a larger correction. There are many possibilities here! Rather than painstakingly analyze each scenario, consider the following. Because the likely 5-wave move down reached under last week's low and is larger than any other wave after [iii], it looks like a significant wave relative to those since wave [iii]. This puts the odds on a complete correction to today's low that began at [iii] or later that is a 'b' or 'x' wave where the rebound with large retracement is possibly, but less likely due to the complexity it adds, a 'b' or 'x' wave of the downward pattern.
If there is the desire to dig into the waves in more detail as I have done, please note a few things on a structural note. (iii) of [v] to (a) of [a] is probably not a sideways correction due to the 3-wave nature of (a). A double zigzag from [iv] to [b] does not work well because the sizes of 'b' waves (ii) and (x) are fairly far apart. The structure of (w) is best as a 3-wave move while (x) can chart well either as a 5 or a 3.
Finally, the labeling of (i) and (ii) after B are a guess. The size of a rally into new all-time high territory will likely be smaller than A, but of a size large enough to not create poor proportionality between the two moves. A 20-point up-day on Monday for instance can be the core of C.
Final Analysis:
Last time it was stated that the potential upside is minimal until a correction occurs. The short-term indicator was marked as "bearish" while additional highs before this occurred were suggested as a possibility. An additional high was seen, then a correction ensued that exceeded last week's low slightly.
There are numerous possible wave counts for the latest consolidation phase of the structure higher since (A), however it is likely that new all-time highs will be seen in the coming days and/or weeks. Although not expected, a dip back to 1990 or the 1980s should prove to be a good buying opportunity for a short-term trade. While on this scale things look bullish, it is likely that an impulse wave higher will not end up being the final wave higher since (A), although an ending diagonal in that position cannot be ruled out. This puts the advantage with the underway sideways correction wave count since [3] which due to structural reasons already had some preference over the possibility for an impulse wave higher since (A), the only other top contender in the long-term. If there really is a sideways correction underway since [3], a continued advance over the wave [3] high actually makes the wave [4] pattern look better next to [2] in terms of size. Likewise, a move under 1900 would also improve the pattern, but there is no guarantee that this will happen.
short-term (days-weeks): bullish to strongly bullish
medium-term (weeks): neutral
medium-long-term (months): bearish
very long-term (years): bullish
blog comments powered by Disqus